At a glance
What is an Excel mind map?
An Excel mind map turns a spreadsheet into a clearer view of categories, data, and relationships. Kiuwo is preparing this flow to help you understand a sheet before analyzing or presenting it.
Excel to mind map
Upload a spreadsheet and make categories, data, and relationships visible.
The map remains editable
AI organizes, you verify
You stay in control of the result
Processing time depends on the file’s length and format
At a glance
An Excel mind map turns a spreadsheet into a clearer view of categories, data, and relationships. Kiuwo is preparing this flow to help you understand a sheet before analyzing or presenting it.
How it works
Kiuwo identifies categories, levels, and relationships in the sheet and organizes them into a map that is easier to explore.
Start from the source
Upload one of the listed file formats. The original material remains the starting point for the map.
Organize
Kiuwo identifies categories, levels, and relationships in the sheet and organizes them into a map that is easier to explore.
Check and reuse
Check the concepts, change the structure, and adapt the map to your goal. The result is not something you have to accept passively.
A concrete result
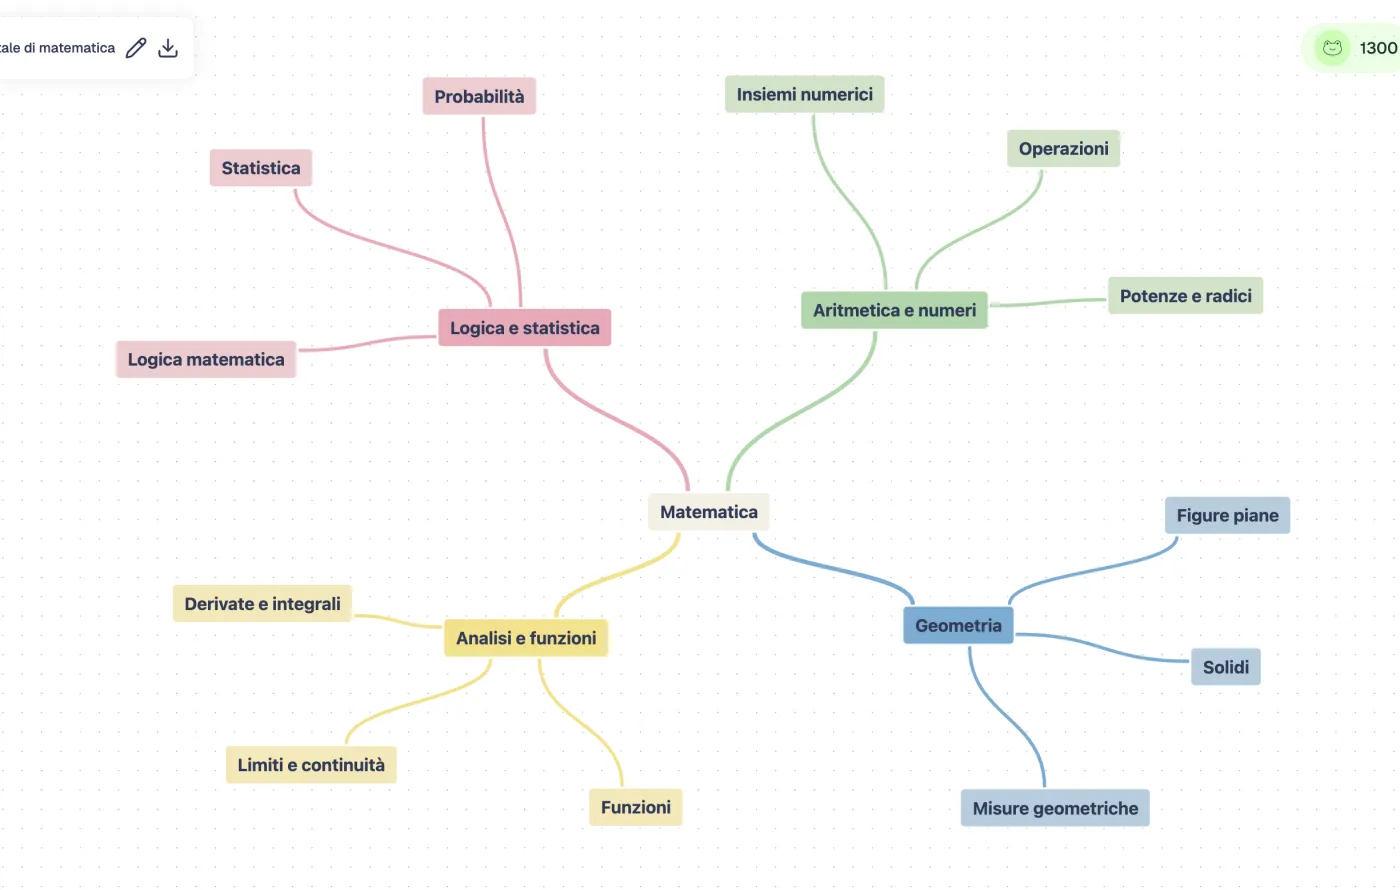
Kiuwo makes concepts, hierarchies, and relationships visible in an editable map. Start from the overview, then return to the details when you need them.
Why it helps
Recognize groups of data and organizational levels that are hard to grasp by looking at cells alone.
Relate values, labels, and categories to better understand what the spreadsheet represents.
Use a first structure to decide which information to explore and how to present it.
Move from a grid of cells to an overview closer to the way you reason about data.
Use cases
The same workflow can help you understand, organize, or reuse material in different contexts.
Organize tables, categories, and data collected during a project or analysis.
Make customers, products, activities, and operational relationships easier to understand.
Find groups, dependencies, and priorities hidden in a working spreadsheet.
Build a visual story before turning numbers and categories into an explanation.
Keep exploring
For documents and narrative sources, use Kiuwo tools for PDFs, text, notes, and web pages.